You are overwhelmed with responsibilities.
You don't have an eye for design and art.
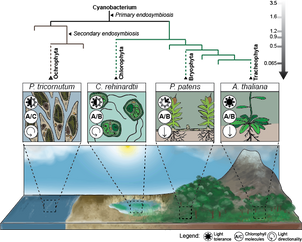
You have graphs that look like this:
and do not know how to make it better
or you think it is perfectly fine.
As a high-end scientist, you deserve the best visuals!
BUT...
Cluttered graphs
Overload with information, the message is buried on it.
Naive design choices
Poor color choices (it hurts, right?)
Poor design choices make your visuals look unprofessional.
Incomplete legends
Audience/reader loses time and interest trying to understand the missing annotations.
Weak visual storytelling
The flow of information is suboptimal, confusing your audience/readers.
Why your scientific visuals aren't hitting the mark
The hidden costs of poor graphics
Missed clients and publishing opportunities
Due to visuals that don't match the quality of your data.
Wasted time on plotting data and design software
You could be focusing on your research.
Inconsistent quality and style across figures
Cohesiveness means professionalism and it's key for impact and clarity.
Well, I've got you covered
Check the galleries below to discover how my work can boost your science and how clever design can transform your work
Hover for color, click for zoom, and press > for more examples
TRANSFORM YOUR DATA INTO PROFESSIONAL VISUALS
TRANSFORM YOUR RESEARCH INTO IMPACTFUL PUBLICATIONS
love
My name is Julia Bauzá-Martinez
I am a doctor in Biomolecular Mass Spectrometry, with a creative and inquisitive mind and an eye for design.
I excel at transforming complex data into clear and effective visualizations. I promise that you won't be disappointed. My visuals will engage your toughest audience.
I thrive in nature, but not without analyzing data. I have fun experimenting with novel, artistic approaches to data visualization (sounds, light, physical media). This may be due to the influence of my dad, a famous artist from Ibiza. Next to my mom, he is the most hard-working person I know, probably I also got this from them.
I launched Skid Visual Science in 2023 aiming to pursue my passions and do what I love: science, data analysis and data visualization. And here I am - excited to learn more about your project and make something amazing together.
Scroll below to read what other's think of working with me!
-
What services do you offer?I offer a range of services including scientific illustration, data analysis and visualization, consultancy, complete proteomic analyses, and scientific writing. I specialize in providing high-quality visuals and comprehensive analysis to help you impress your clients or target journals.
-
Can you help me present my data in a unique and artistic way?I can help you explore more creative and experimental ways to present your data, to help you connect with your audience on a deeper, more emotional level. We can experiment with artistic visualizations — think bold colors, visual metaphors, light- or sound-based visualizations, engaging infographics, or even unconventional formats like interactive visuals, postcards, posters, or other media.
-
What is the process from start to end at Skid Visual Science?Initial Discussion: we begin with a video call to discuss in detail your project and needs. Quotation and Time Estimates: I will draft a tailored quote and time estimates based on your specific project requirements and send it your way. For illustration or data visualization projects, time estimates are highly dependent on the project. For example: Very simple figures (e.g., making a graph on R): 1-2 hours Simple figures (e.g., a workflow summary): 5-10 hours Complex figures with custom elements (e.g., a graphical abstract): 10-20 hours Custom elements can include hand-drawn illustrations, design choices and color selection, shading/highlights, artistic elements, or 2D vs 3D designs. In addition, some time is allocated for project-related research, meetings, and revisions to ensure the final result meets your expectations. Payment: A 50% deposit is required to begin the work, with the remaining 50% due upon completion and delivery of the final files. Important Note: If the project requires fewer hours than estimated, the final payment will be adjusted based on the actual hours worked.
-
How much does it cost?Prices for my services start at 52 EUR/h (Excl. VAT) for data visualization/illustration and 68 EUR/h (Excl. VAT) for data analysis/research. However, each project is different and must be assessed individually. Please get in touch with me to discuss your project and ideas, and I will provide you with a personalized quotation swiftly. Still intrigued? Some estimates are below: Illustrations & Infographics: 100 - 2,000 € Graphical Abstracts: 250 - 1,000 € Cover Artwork: 500 - 2,000 € Figure Formatting/Polishing: 100 - 500 € / figure Data to Graphs: from 130 € Complete Data Analyses: from 1,300 € Important Note: When applicable, VAT will be added to the above prices.
-
Do you offer special rates for low-income or developing regions?Access to high-quality scientific data visualizations and proteomic analysis should be available to research institutes worldwide. Unfortunately, this is often biased, with the most impactful research typically occurring in wealthier countries, which have access to more resources, including professional illustration and analytical services. I recognize that budget constraints can be a challenge. My standard pricing reflects the actual costs required to provide these services on Europe. However, I am open to considering requests on a case-by-case basis for individuals facing genuine financial difficulties. If you find yourself or your institution in such a situation, please contact me to discuss your circumstances, and I will do my best to accommodate your needs.
-
How does payment work?Upon acceptance of the quote and agreement to work together, a 50% deposit is required to begin the work, with the remaining 50% due upon project completion and delivery of the final files. Payments are done via bank transfer. Payments must be sent in Euros whenever possible, and otherwise conversion rates and fees will be discussed in advanced. Important Note: If the project requires fewer hours than estimated, the final payment will be adjusted based on the actual hours worked.